Market Snapshot — May 28, 2026
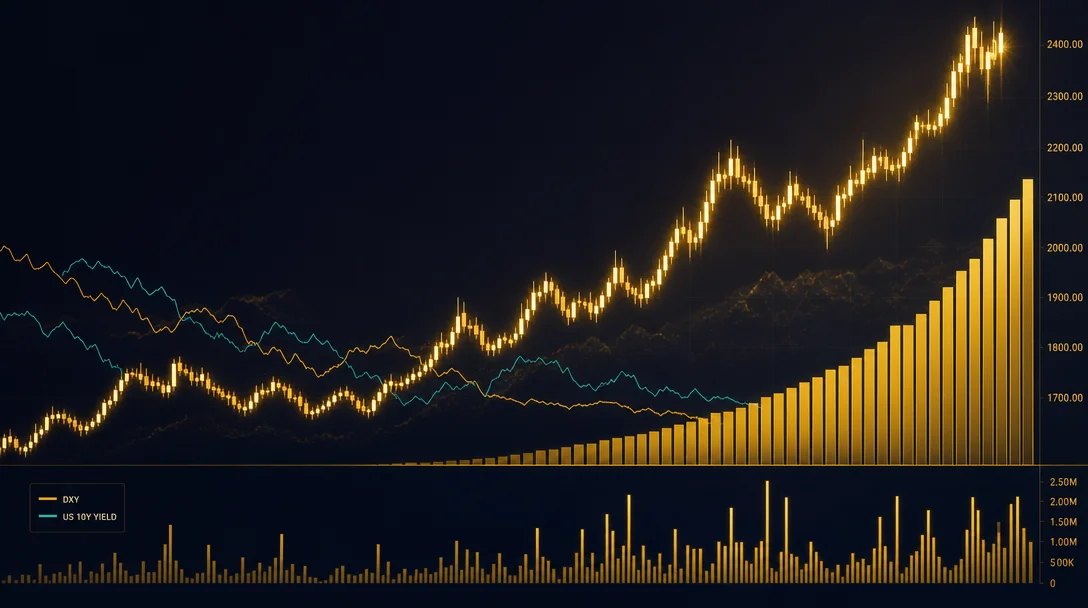
XAUUSD Weekly Trading Brief: June 2–6, 2026 — Neutral-Cautious Bias, NFP Week Ahead
Gold pulls back to $4,382 after a sharp 1.6% selloff. This week's analysis covers the full weekly price channel ($4,280–$4,550), a structured news impact table for ISM, ADP and Friday's NFP print, three probability-weighted scenarios (bullish 25% / range-bound 45% / bearish 30%), and a complete long/short/no-trade plan with defined entry zones, confirmation rules, and invalidation levels.

XAUUSD Weekly Gold Trading Brief — June 2, 2026
Week of June 2–6, 2026 | Issue #1
⚠️ Risk Disclosure: This analysis is for educational and informational purposes only. It does not constitute investment advice or a solicitation to trade. All scenarios carry probability estimates, not certainties. Trading gold carries significant financial risk. Verify all data points against your own sources before making any trading decision.
Current Market Bias: ⚠️ Neutral–Cautious (Leaning Bearish in the Near Term)
Gold is pulling back from recent highs after a sharp single-session decline. The macro environment is mixed: DXY is firming while the 10Y yield has risen to 4.521%, both headwinds for gold. However, geopolitical risk (US-Iran tensions) and a historically elevated price structure keep the medium-term bullish case intact.
Confirmed data as of May 28, 2026, Asia/Shanghai open:
| Indicator | Value | Change |
|---|---|---|
| XAU/USD Spot | $4,382 | −1.6% (−$67) |
| Day Range | $4,367 – $4,465 | — |
| 52-Week Range | $3,246 – $5,595 | — |
| DXY (US Dollar Index) | 99.46 | +0.25% |
| US 10Y Treasury Yield | 4.521% | +3.3 bps |
| US 30Y Treasury Yield | 5.041% | Elevated |
| WTI Crude Oil | $91.60 | +3.29% (Iran risk) |
| Next FOMC Meeting | ~June 17, 2026 | ~20 days away |
Loading stats card…
Weekly Price Channel
Gold has been trading in a historically elevated range. Following a multi-week rally that brought price into the $4,400s–$4,800s zone, the current pullback is testing a key reclaim zone. The analysis below is derived from the confirmed 52-week range ($3,246–$5,595) and recent daily structure.
| Zone | Level | Description |
|---|---|---|
| Upper Resistance | $4,500–$4,550 | Recent swing high cluster; strong sell pressure observed |
| Breakout Trigger | Above $4,550 | Requires daily close + retest confirmation |
| Midline / Fair Value | ~$4,420 | Approximately mid-channel for current month |
| Current Price | $4,382 | Below midline — caution zone |
| Support Zone 1 | $4,340–$4,360 | Prior consolidation base; first line of defense |
| Support Zone 2 (Key) | $4,280–$4,300 | Strong structural support; major demand zone |
| Breakdown Trigger | Below $4,280 | Confirms bearish shift; targets $4,150–$4,200 |
| Best Buy Zone | $4,280–$4,320 | Only after rejection + bullish reclaim candle |
| Best Sell Zone | $4,500–$4,540 | Only after clear rejection candle near resistance |
| False Breakout Warning | $4,540–$4,570 | High-risk zone — spikes can be traps |
Protocol Reminder: Do not enter at midline ($4,420) with no directional confirmation. Wait for price to reach the defined buy or sell zones, then require a full session close plus a retest hold before entry. A single candle is not enough.
Macro Drivers: What's Moving Gold
US Dollar Index (DXY): Mild Headwind
The DXY is trading at 99.46, up 0.25% on the session and up 1.43% over the past month 2. The dollar has been recovering from its 3-year low against the yuan and multi-year lows across other pairs. A DXY holding above 99 is a moderate headwind for gold: the two historically show an inverse correlation, though that relationship has weakened in 2025–2026 as central bank demand for gold has partly decoupled from the dollar cycle.
A DXY break above 100.64 (52-week high) would represent a meaningful bearish catalyst for gold. Conversely, any dollar reversal below 98–97.5 would be bullish for XAU.
US Treasury Yields: The Critical Variable
The 10Y yield is at 4.521% — up 51.3 basis points over the past 3 months and 34.9 bps year-to-date 3. The 30Y yield stands at 5.041%, a level that increases the opportunity cost of holding non-yielding assets like gold.
Real yields (nominal yield minus inflation expectations) are the more direct driver. With US CPI having trended around 3.0–3.5% in recent months and 10Y TIPS pricing in inflation expectations of approximately 2.3–2.5%, real yields are roughly +2.0–2.2% — elevated but not extreme. Real yields at this level historically compress gold's upside but don't necessarily trigger sharp selloffs unless they break materially higher.
Watch level: If the 10Y yield breaks above 4.70% (52-week high), real yields would tick up sharply — that would be a meaningful bearish signal for gold. A yield retreat to 4.30% or below would be supportive.
Federal Reserve (FOMC): No Surprise Expected — But Language Matters
The next FOMC meeting is approximately 20 days away (~June 17, 2026) 4. As of the current session, market pricing in Fed Funds futures has not shifted dramatically — the CME FedWatch tool is tracking its countdown at 20 days, and interest rate traders will be scrutinizing any FOMC-adjacent communications this week.
No rate decision is due this week, but any Fed speaker commentary on inflation stickiness or rate-cut timing will move gold. Hawkish language (rates higher for longer) = gold headwind. Dovish pivot signals (inflation cooling, rate cuts approaching) = gold tailwind.
Geopolitical Risk: Elevated — US-Iran Tensions in Focus
WTI crude oil surged +3.29% to $91.60 on renewed US-Iran hostilities. Gold typically benefits from geopolitical risk via safe-haven demand, but the mechanism operates with some lag. When oil spikes on geopolitical grounds and simultaneously pushes inflation expectations higher, real yields can compress — which is bullish for gold. However, if the geopolitical situation de-escalates (e.g., reports of a US-Iran Hormuz deal framework 2), this premium can unwind quickly.
Pattern to watch: Gold and oil moved inversely today — oil up, gold down. This suggests the session's gold decline was driven more by DXY strength and yield pressure than by the risk-off channel.
News Impact Table: This Week's Key Events
The following table covers anticipated high-impact events for the week of June 2–6, 2026. Note that the specific data releases (NFP, PCE exact timing) should be verified against official US BLS and BEA schedules before trading.
| Event | Expected Impact on Gold | Bullish / Bearish Logic |
|---|---|---|
| US ISM Manufacturing PMI (Mon) | Low–Medium | Weak PMI → risk-off, mild gold support; strong PMI → dollar up, gold down |
| Fed Speaker(s) (Mon–Tue) | Medium | Hawkish tone on rates = bearish gold; pivot signals = bullish |
| US ISM Services PMI (Wed) | Medium | Strong services = stronger dollar; weak = dollar softens |
| ADP Employment Change (Wed) | Medium | Stronger-than-expected jobs = delays rate cuts = gold headwind |
| US Jobless Claims (Thu) | Low–Medium | Rising claims = economy softening = bullish gold (anticipates Fed dovish pivot) |
| US Non-Farm Payrolls (NFP) (Fri) | HIGH | Hot NFP (+200k+) = dollar surges, yields up, gold selloff. Weak NFP (<150k) = dollar weakens, gold rally |
| US Unemployment Rate (Fri) | High | Rising unemployment = rate cut expectations up = gold bullish |
| US Average Hourly Earnings (Fri) | High | Wages above +0.4% MoM = inflation sticky = bearish gold |
| US-Iran Geopolitical Developments (ongoing) | Variable | Escalation = safe-haven gold spike; de-escalation = gold premium unwinds |
| FOMC Beige Book / any Fed note | Medium | Data-driven; watch language on inflation and labor market |
⚠️ NFP Friday Rule: Do not hold large open positions through Friday's NFP print. The spread widens, stop hunts occur, and the real direction often takes 30–60 minutes to establish after the release. Wait for the initial spike to resolve and a directional candle to close before entering.
Loading chart…
5-Day Price Outlook (June 2–6, 2026)
All scenarios are probabilistic — not predictions. Confirmed data points are as of May 28 close.
Three Scenarios
🟢 Bullish Scenario (Probability: ~25%)
Trigger conditions: DXY reverses below 98.50; 10Y yield retreats below 4.40%; geopolitical risk intensifies pushing safe-haven demand; NFP Friday miss below 150k.
Price path: Recovery from current support ($4,340–4,360) → reclaim of $4,420 midline → test of $4,480–4,500 by Friday. Breakout above $4,550 requires post-NFP follow-through.
⚠️ Range-Bound Scenario (Probability: ~45% — Most Likely)
Trigger conditions: DXY holds 98.5–100; yield range-bound 4.40–4.60%; no major data surprises; NFP in line with consensus (~180k).
Price path: Gold oscillates between $4,340 support and $4,460–4,480 resistance. Multiple false moves in both directions. Chop zone — low win-rate for directional traders.
🔴 Bearish Scenario (Probability: ~30%)
Trigger conditions: DXY breaks above 100; 10Y yield prints 4.65%+; NFP significantly beats (220k+) combined with hot wages; Iran tensions ease.
Price path: Support at $4,340 fails → test of $4,280–4,300 key zone. If that fails with a daily close below $4,280, targets $4,150–4,200. This would be a meaningful retracement of the recent rally.
Day-by-Day Read
| Day | Directional Lean | Key Level to Watch | Trigger |
|---|---|---|---|
| Monday Jun 2 | Neutral–Slight bear | $4,360 support hold | ISM Mfg PMI; DXY continuation |
| Tuesday Jun 3 | Neutral | $4,380–4,400 reclaim | Fed speaker tone; any Iran updates |
| Wednesday Jun 4 | Neutral | $4,420 midline | ISM Services + ADP; yield direction |
| Thursday Jun 5 | Slight bull setup possible | $4,340 support retest | Jobless claims; pre-NFP positioning |
| Friday Jun 6 | High volatility — no bias | $4,300 / $4,460 pivots | NFP + wages + unemployment rate |
Loading chart…
Trading Plan for the Week
Long Setup
- Entry zone: $4,280–$4,320 only
- Confirmation required: 4H candle close back above $4,320 after testing the zone; ideally a bullish engulfing or hammer structure
- Target 1: $4,380–$4,400 (partial exit)
- Target 2: $4,460–$4,480 (swing target if momentum holds)
- Stop loss / Invalidation: Daily close below $4,270 — this invalidates the demand zone and signals the bearish scenario is unfolding
- Risk/reward required: Minimum 1:2 before entering
Short Setup
- Entry zone: $4,500–$4,530 only
- Confirmation required: 1H or 4H rejection candle (bearish engulfing, shooting star) followed by a lower close; do not short on first touch
- Target 1: $4,440–$4,420 (partial exit)
- Target 2: $4,360–$4,340 (full swing target)
- Stop loss / Invalidation: Hourly close above $4,555 with continuation momentum — exit immediately, as this signals a potential breakout, not a rejection
- Risk/reward required: Minimum 1:2 before entering
No-Trade Conditions
- Mid-range price ($4,380–$4,460): No entry in either direction. This is the chop zone where news-driven wicks and false moves are most frequent.
- During high-impact news (ISM prints, ADP, NFP): Close or hedge existing positions 30 minutes before release. Re-enter only after the spike resolves and a new candle confirms direction.
- If DXY and yields are moving in opposite directions: The signal is unclear — stay flat until one resolves.
- Fake breakout into range: If price spikes above $4,550 then closes back inside $4,500 on a 4H candle — this is a trap. Consider the opposite short setup with a tight stop above the wick high.
Risk Warnings
Main Risk
The primary structural risk is a repricing of US Treasury yields to new highs. The 10Y at 4.521% is already elevated 3, and a hot NFP Friday print or hawkish Fed comment could push it toward or above the 52-week high of 4.69%. That scenario would increase real yields sharply and historically compress gold prices 2–4% within days.
Fake Move Risk
Gold's current position — between support and resistance, near a midline, ahead of high-impact data — is a textbook fake-move environment. Expect:
- A spike below $4,340 designed to trigger stops, then a rapid reversal (if buyers step in)
- A spike above $4,460 on thin liquidity, then a rejection (if sellers defend resistance)
The rule: A candle wick through a level is not a breakout. Only a full candle close counts. Wait for the second candle to confirm the direction.
News Risk
NFP Friday (June 6) is the highest-risk event of the week. Historical data shows gold can move $50–$100 in the 30 minutes following NFP. The spread on XAU/USD widens to 5–15 pips or more at brokers during the release. Unless you have a specific pre-positioned setup with a very tight plan and controlled spread, the best practice is to:
- Close or reduce positions to 25–50% size before the release
- Let the initial spike (up or down) complete
- Watch for a 15-minute or 30-minute candle to close in a clear direction
- Enter with a defined stop above/below the NFP spike extreme
What to Check Before Trading This Week
If any of the following data points are unavailable to you at trading time, do not size into directional positions:
- 10Y yield live level — check MarketWatch or Bloomberg for real-time data
- DXY direction intraday — if DXY is trending up hard, avoid gold longs
- CME FedWatch probability shifts — any move >5% in June rate expectations overnight changes the calculus
- NFP consensus estimate — if consensus shifts significantly from ~180k, recalibrate your scenarios
- US-Iran headline status — a deal or further escalation this weekend will gap gold at Monday open
- GLD/IAU ETF flows — weekly flow data shows whether institutional money is accumulating or distributing; unavailable to verify this issue, will be tracked in future editions
Next issue: Published Monday June 9, 2026 at 08:00 Asia/Shanghai. Analysis will incorporate Friday's NFP result, any Fed commentary from this week, and updated technical structure based on the week's actual closes.
This analysis is for educational purposes only. Past analysis does not guarantee future accuracy. All trading involves risk of loss. Not financial advice.
Add more perspectives or context around this Drop.